Elliot Wave theory
The Elliott Wave theory is very popular within the trading community. It was developed in the 1930s by Ralph Nelson Elliott. This theory is a technical analysis method in which patterns are used to identify market fluctuations. It is also used combined with the Fibonacci Retracement indicator to calculate the the market price goals.
The market fluctuation is divided in major trends, impulsive waves and corrective waves.
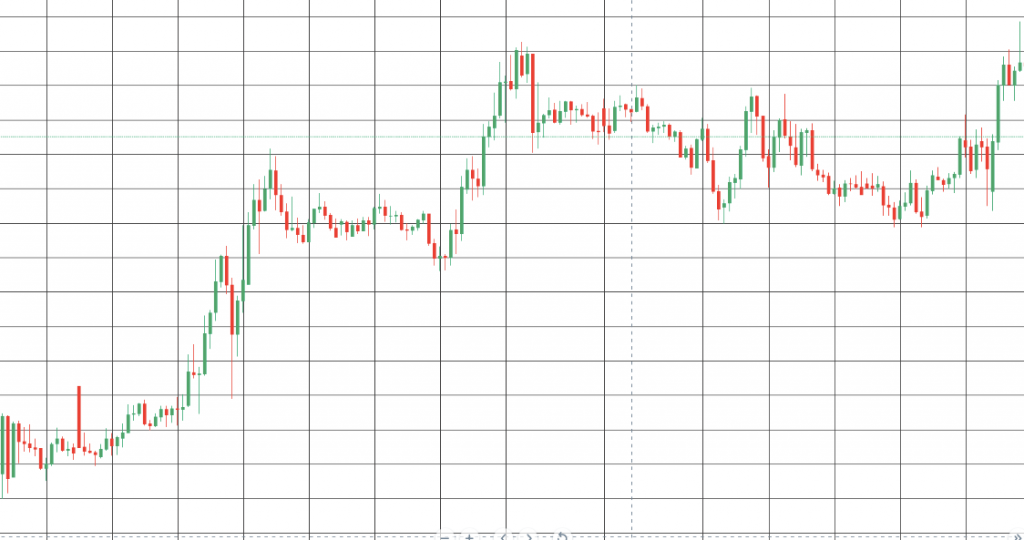
Notice, this theory does not only work in an uptrend but also in a downtrend. If the waves are going up within the pattern they are called impulsive waves and in a downtrend they are called impulsive down waves. You are probably wondering how does this look like?
Do you see it?

figure 1
Impulsive waves
The basic rules of Elliott Waves are the following:
-The end of wave 2 can never retrace below the lowest point of wave 1.
- Wave 3 is never the shortest waves of the three waves that form the trend which are wave 1,3 and 5.
- Wave 4 can never below the top of wave 1.
Corrective waves
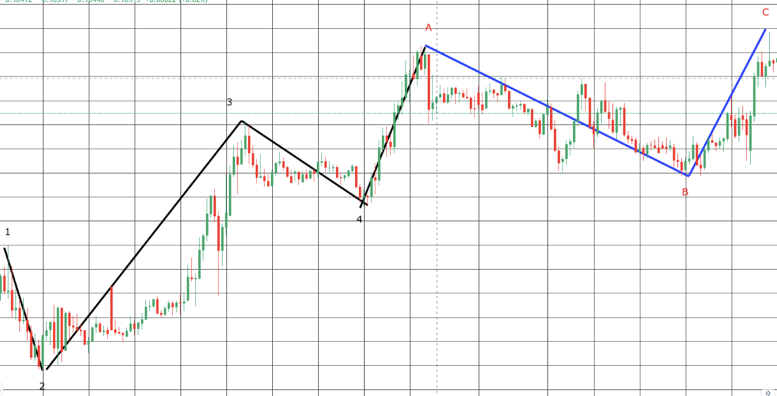
Are waves that move in the opposite direction of the major trend. These corrective waves are the follow up of the trend. Often these corrective waves are labeled with A, B and C. and in some cases also A, B, C, D and E. It often happens that if the previous corrective waves consisted out of three waves (A, B and C) the chances of having five corrective waves after the impulsive wave is high.

the basics of the Elliot Wave theory applied in figure 1
Notice this is only the basic explanation of the theory in reality it is a very complex theory which requires a lot of study time to really understand everything. If you are interested in learning more about The Elliott Wave theory, I recommend you to read, Elliott Wave Principle by Frost and Pretchter.
Written by Juan Pablo’


